
Activating Debug Mode
The first obvious step to benefit from WordPress debug functionality is to activate it correctly. There are several directives associated with the debug system that lets you customize the debug environment according to your needs. Here's the first primary directive that activates the debug mode. You have to include all these directives in wp-config.php file.define('WP_DEBUG', true);
Once debug mode is activated, by default all the notices, warnings or errors are displayed directly on the screen. This generally makes the screen cluttered and makes it impossible to navigate through different options and menus within the dashboard. To get rid of this problem, you must suppress debug trail display on the screen. Here's the directive to do that.
define('WP_DEBUG_DISPLAY', false);
define('WP_DEBUG_LOG', true);
define('SAVEQUERIES', true);
Using The Log File
The log file generated by WordPress contains complete timestamped PHP stack trace to find out errors, bugs, and deprecated code. Although you can filter out deprecated function calls from the log file, I'll strongly recommend using Log Deprecated Notices plugin that makes it very easy to monitor any usage of deprecated code within your theme or plugin.
The log file is very easy to interpret and follow. The leftmost column contains the timestamps when the events took place. The red arrows in the picture show notices and warnings along with an explanatory message. Each section contains the function calls in chronological order from top to down. This way you can easily track where the code needs to be corrected or optimized.
Plugin Assisted Debugging
If you don't want to mess with cryptic log files or manual directive insertions, you can use several powerful debugging plugins available for WordPress developers. Here are some of the select plugins that can be used to easily debug your WordPress code.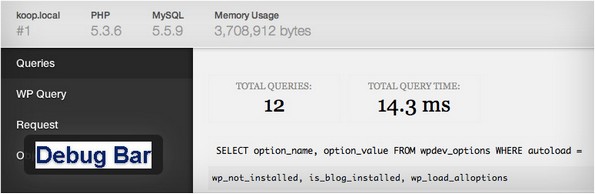
Debug Bar - This is the most popular and widely used plugin by WordPress developers. It adds a handy debug menu within the top admin bar and provides several vital details to help you optimize the code. If you've already enabled debug mode along with 'SAVEQUERIES directive in the wp-config.php' file, you must also install Debug Bar Console plugin that attaches a PHP/MYSQL console to the existing debug bar for displaying all PHP and MySQL debug information. The combination of both these plugins gives you an all-in-one debugging monster to help you write the most bug-free and complaint code for your theme or plugin.

SM Debug Bar - This is yet another useful debugging plugin for theme and plugin developers. This handy solution lets you watch and print the value of PHP variables in real time within the dashboard. It creates a debug button in the admin bar to access the debug console. It's perfect for optimizing your queries and data-intensive routines while writing functions for your theme and plugins. Its sliding console presents the values through a nice interface making the code inspection very easy. Once installed, access to this console is only reserved for administrators so that general user cannot fiddle with the code without your permission.
